

The Herald today has:
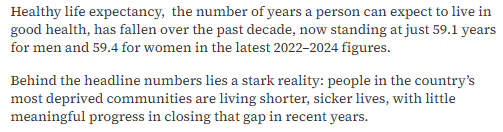
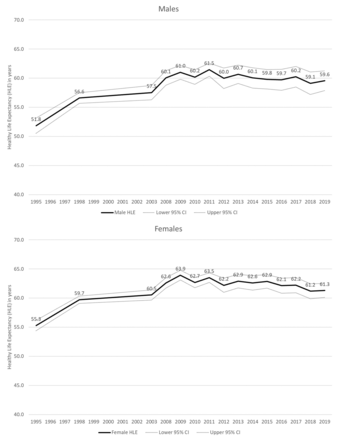
The graph above from the BMJ in 2022 puts the trend in an historical perspective, revealing that expected life expectancy in ‘good health’ remains significantly higher than it was 30 years ago.
The Herald report surprisingly, or not, dies not seem to have looked at the work of Glasgow University researchers led by David Walsh in 2022, which found
Concerning changes in mortality and life expectancy trends have been observed across the UK since the early 2010: a ‘stalling’ of previous improvements alongside worsening trends among more deprived populations. Although the causes are still debated in some quarters, a considerable amount of evidence suggests that UK Government ‘austerity’ measures—cuts to public spending, including an unprecedented reduction in social security payments which have had a disproportionate effect on the poorest and most vulnerable—are most likely the key driver.1–7
Has the UK Labour government, since July 2024 reversed the above cuts in an attempt to reverse the falling trend in healthy life expectancy?
No, the UK Labour government (in power since July 2024) has not significantly improved public spending and benefits in a way that reverses the downward trend in healthy life expectancy (HLE) or the effects of post-2010 austerity, as described by David Walsh and colleagues, and Prof Danny Dorling has written in response to the Labour Chancellor’s spring statement, a year ago:
UK welfare reforms threaten health of the most vulnerable 8
Sources:
- ↵
- Hiam L ,
- Harrison D ,
- McKee M , et al
- ↵
- Dorling D
- ↵
- Fenton L ,
- Wyper GM ,
- McCartney G , et al
- ↵
- Alexiou A ,
- Fahy K ,
- Mason K , et al
- ↵
- Walsh D ,
- McCartney G ,
- Minton J , et al
- ↵
- Bennett JE ,
- Pearson-Stuttard J ,
- Kontis V , et al
- ↵
- Rashid T , Bennett JE , Paciorek CJ , et al
- https://www.dannydorling.org/?p=10410
Discover more from Talking-up Scotland
Subscribe to get the latest posts sent to your email.

Life expectancy will change. Child payment will help eradicate poverty. The health of the mother on conception can influence the health of the child. Increased nursery places help mothers to work. Average income increase.
Scotland unemployment rates low. MUP has cut the rate of consumption.Young people are drinking less. More aware of health issues. People are stopping smoking. 20%. More people not smoking. Diet could improve.
Japan life expectancy. Highest in the world 85. Spain 84. UK 79. US 76.
Thatcher and Tory austerity have made people sick. Thatcher cut the Scottish budget. Took all the revenues and resources. Lied about it and kept it secret under the Official Secrets Act. The McCrone Report. Tory austerity 2010-24. Did not fund NHS properly. Until Covid. Spent £270Billion over two years. Too much fraud. Cut welfare £18Billion. Cut education £6Billion a year (£60Billion). Wasted £Billions on HS2, Hickley Point etc. £Billions which could have eradicated poverty. Thatcher spent the Oil revenues on London S/E. Tilbury Docks, Canary Wharf. The North/South divide. Congestion in the South. The North empty,
The SNP has to mitigate against all the cuts. Devolution 2000. Income tax changes. Weathier pay more. Child payments, more nursery places, personal care. Trying to eradicate poverty. More people in work. Building affordable homes. Kinship payment. Less children in care.
Independence would be even better. Scotland in surplus in fuel and energy would benefit. EU membership. Cut Defence spending. Get rid of Trident and redundant weaponry. Paying off UK loans not borrowed or spent in Scotland. Scotland could save £Billions and revenues could be better spent.
LikeLike