

Support Talking-up Scotland's work to counter the lies and get you the facts, daily, at: https://www.crowdfunder.co.uk/checkout/help-talking-up-scotland-tell-truth-about-scotland/payment/nBQxjVzq/details or by direct bank transfer method - Sort code 08-91-04, Account 12266421
Professor John Robertson OBA
From BBC Health today, the above and:
New league tables rating the performance of NHS trusts in England have been published for the first time, with specialist hospitals taking the top slots. Number one is Moorfields Eye Hospital NHS Foundation Trust, followed by the Royal National Orthopaedic Hospital NHS Trust and cancer centre the Christie NHS Foundation Trust.
At the bottom is Queen Elizabeth Hospital in King’s Lynn, which has had major problems with its buildings because of structural weaknesses and the need for props to hold up ceilings. Health Secretary Wes Streeting said the tables will identify where “urgent support is needed” – but trusts have questioned whether the league tables were using the right metrics.
The Guardian was more concerned:
The health secretary, Wes Streeting, said the move would help banish the “postcode lottery” in the speed and quality of treatment. But health experts cautioned that it was impossible to capture correctly whether any hospital was “good” or “bad” and that the results could prompt patients to avoid seeking help at lower-rated ones.
Thea Stein, the chief executive of the Nuffield Trust thinktank, said the fact that trusts’ finances were used to judge them meant that the league tables would be “of limited use for patients trying to choose the best hospital for their care”. She added: “The scheme also risks discouraging people from getting treatment from poorly performing trusts or staff from working for them.”
Small trusts, and those in remote areas, some of which have struggled to provide high-quality care, could be badly affected, Stein said.
Fortunately, after 18 years, such worries are not present in NHS Scotland as all of our hospitals are broadly the same – good.
My evidence?
First, overall, there is no postcode lottery in Scotland’s hospitals and Glasgow’s super hospital is actually safer than average
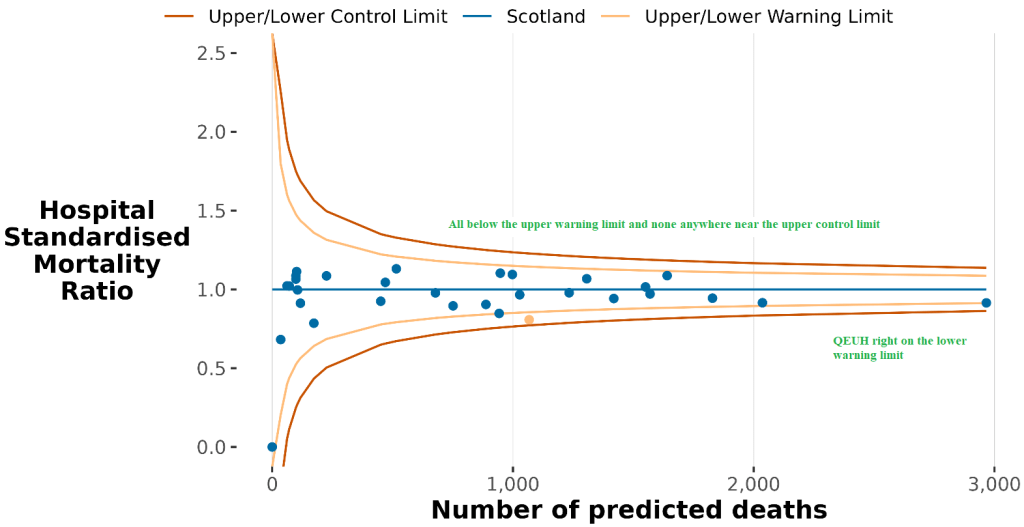
From Hospital Standardised Mortality Ratios April 2024 to March 2025 published today, the above graph reveals that all of Scotland’s hospitals have mortality ratios within the normal range confirming the complete absence of any postcode lottery here.
Of particular interest, the large Queen Elizabeth University Hospital, extreme right, often unjustly criticised in media and serving one of the most disadvantaged populations in Scotland, has a below average mortality ration of 3.7, below the Scottish average.
In England, we see more evidence of a two-tier system here with a cluster of hospitals in affluent areas revealing as many as 700 fewer deaths than predicted and others in the north, with the same number, in excess of even predictions made in the full knowledge of the local poverty-levels. In England, it makes a huge difference to your chances if you attend in Chelsea as opposed to Lancashire.
https://digital.nhs.uk/data-and-information/publications/statistical/shmi/2025-07johnrobertson834Edit
Second, on one aspect of cancer care:
From Public Health Scotland 14 May 2025:
711,189 women were invited, and 539,575 attended, a routine breast screening appointment. This equates to more than three in four women (75.9%) taking up their screening invitations. This is an increase on the previous three-year period (2019/22), when uptake was 74.5%, and pre-pandemic (2017/20), when uptake was 72.2%.
All NHS boards individually met the acceptable uptake standard of 70% for the three-year period (2020/23): This is the second time this has happened since 2008/11, with the first time being the 2019/2022 period.
Discover more from Talking-up Scotland
Subscribe to get the latest posts sent to your email.

As has been highlighted before on TuS, one needs to look closely and critically at performance statistics for NHS England. They are not always what they seem – cf. 12 hour A&E waits. The Nuffield Trust is now exposing yet more dodgy data.
Source: Nuffield Trust (August 13 2025) Why is the planned care waiting list coming down and what does the data really tell us?
Context: ‘When Wes Streeting celebrated the improvement in the waiting list – saying “thanks to our interventions and the hard work of NHS staff, the overall waiting list has now fallen in April for the first time in 17 years” – the most straightforward assumption was that the NHS is delivering more operations and appointments that reduce the overall list of people waiting. But is this really the case?’ (my emphasis)
But: ‘In any given month, we expect the size of the waiting list to equal the incomplete pathways from the month before, plus new referrals in the given month, minus the reported completed pathways in the given month. But when we compared our calculated expected waiting list figures to the reported waiting list in the publicly available data, the size of the reported waiting list has been consistently smaller than the expected waiting list.
‘This shortfall between the expected and reported waiting list represents pathways that are not reported as completed pathways, but removed from the list anyway, and can be described as “unreported removals”. Over the two previous complete financial years (from April 2023 to March this year), there have been on average 244,578 unreported removals a month (unadjusted for working days), and 7,566,344 incomplete pathways (making up the reported waiting list) a month. This means that, on average, unreported removals equate to around 3% of the size of the waiting list. For context, the waiting list dropped by 29,814 between April and May this year, or by 0.4%.’
It adds: ‘.. across several months, there were more pathways being removed from the waiting list without being marked as complete than pathways joining the list.’
The Nuffield Trust concludes: ‘The information available in the public domain is insufficient for independent scrutiny of the elective waiting list, and consequently for holding government to account. Removals from the waiting list should be described in publicly available data in a meaningful way; the current process is unduly obscure. Until more transparent reporting is provided, accountability around unreported removals remains impossible and the planned care waiting list will continue to be a misleading indicator of how the NHS is dealing with demand.’
The above would have been headline news from BBC Scotland, The Herald and the rest – with “shameful” and similar in quotes from opposition politicians and ‘leading’ doctors from the BMA and royal colleges – IF the Nuffield Trust had been referring to NHS Scotland!
LikeLiked by 4 people
The data don’t does, they do? You researchers eh? These days?
LikeLike
Let’s not forget Wes Sterling’s famous words .
All roads lead to Westminster,” Wes Streeting declared at around the time we were reading Anas Sarwar’s lips, pointing the finger at the Tories in Westminster when his Welsh Labour colleagues were under pressure on NHS spending. It’s probably the one time I’ll ever agree with Wes Streeting.
LikeLiked by 1 person
So , now we have :
”Lies , Damned Lies and Wes Streeting’s NHS Statistics ”.
LikeLiked by 1 person