

Support Talking-up Scotland to keep rebutting the lies almost every day of the year, at https://t.co/xFcIcegHTy
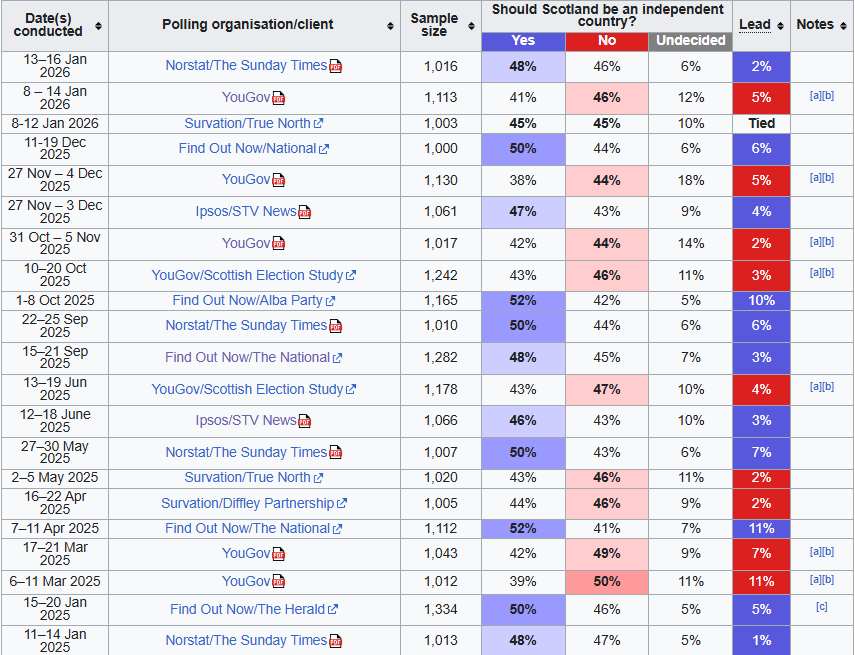
I’ve written before about YouGov‘s unerring and almost unique (Survation too) ability to pluck a No lead out of a trend dominated by Yes leads, found by various other pollsters. It’s been a long time since they found a Yes lead. They seem to prevent it by adjusting (weighting) their sample to have 55% No voters and 45% Yes voters as in 2014 and thus get the same result ten years later.
James Kelly of Scot Goes Pop has already reported on this at: https://scotgoespop.blogspot.com/2026/02/why-is-yougov-under-representing-yes.html but I’d like to see the numbers.
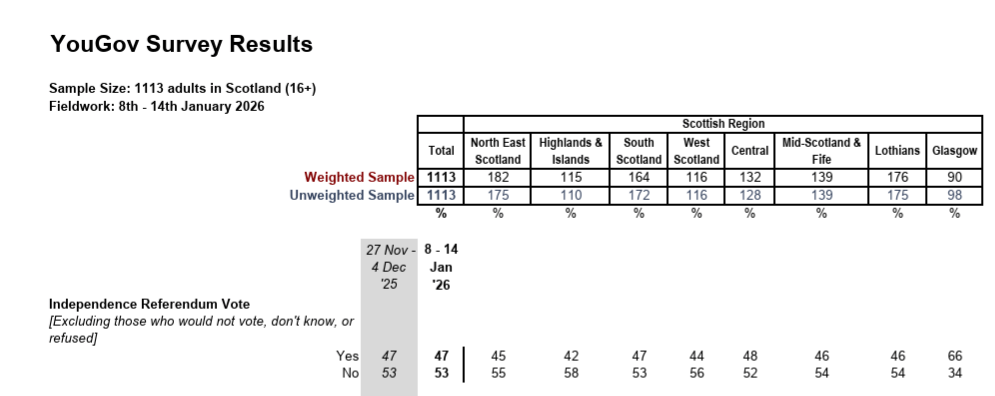
You see above, instantly, the anomaly of the small Glasgow sample? They have actually been doing it for at least a year in all their polls and gradually reducing the Glasgow sample. In March 2025, it was 116. then 104, then 102, then 109 and most recently, 90! Notice also that only the Glasgow sample suggests a Yes lead even after they have weighted it according to the 2014 result.
I’m really annoyed to have not noticed this before.
Here are the populations of 8 electoral regions in Scotland from which the list MSPs are selected, the sample for each used by YouGov and the consequent ratios:
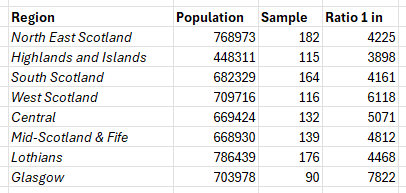
These are shocking differences between the Glasgow and other regions and inexplicable other than in an intentional attempt to distort the actual level of support for independence.
In, for example, in an area where they find a No lead comparable to that in 2014, such as the North-east, they sample around 1 in 4 000 but in an area where the Yes lead is large, Glasgow, they only sample 1 in nearly 8 000. To be representative the Glasgow sample should be twice as big but that would shift their overall No lead and they don’t want us thinking that do they?
Support Talking-up Scotland to keep rebutting the lies almost every day of the year, at https://t.co/xFcIcegHTy
Discover more from Talking-up Scotland
Subscribe to get the latest posts sent to your email.

It’s no surprise that YouGov continue to distort Scottish polling data: YouGov was founded by deep-rooted Tories Nadhim Zahawi and Stephan Shakespeare. It’s an archetypal English right-wing organisation: Scotland only matters to them if their colonial attitudes are at risk.
LikeLike
In times past, repeated bad sampling resulted in said polling company losing a lot of business, so it made sense to get it right. Now they seem to be almost astro turfed, and can call on the deep pockets of their backers.
Polling companies are almost as blatant as the state broadcaster these days. Maybe they always were, and we were just less able to share the data.
LikeLike
This is outrageous deception and manipulation. Well done for spotting it. I looked into regulation in the polling industry some time ago. But the British body which pollsters belong seems to have no sanction against cheating.
Are we all thoroughly sick of the endless corruption of the British state? On the positive side it does seem to be falling apart before our eyes.
LikeLike