


stewartb making this comment below, yesterday, reminded of how previously, he, I and others have revealed the trickery used by NHS England, operating in a Tory/competitive/managerialist culture, contrary to the public service model still operating in Scotland, have found ways to massage their published statistics.
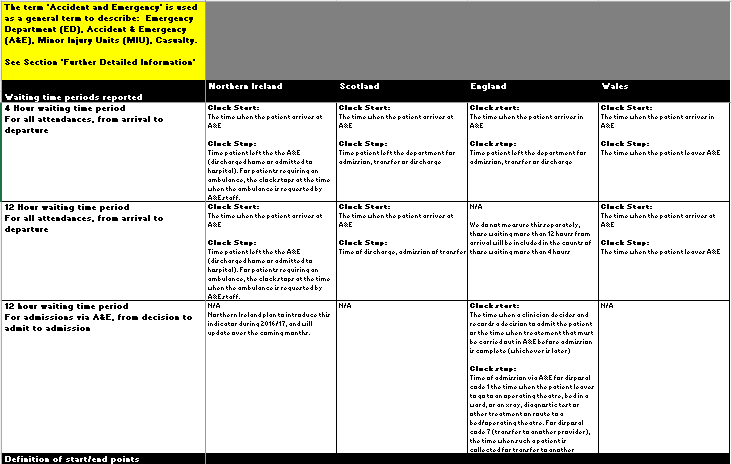
When comparing statistics on long periods spent in A&E in England with those in Scotland, it is always important to check the exact nature of the metric being used.
For NHS Scotland, it is always likely to be time spent since arrival up to admission, discharge or transfer.
For NHS England the metric in use could be the same as the latter but it could also be time spent AFTER a decision to admit has been made. There is a significant difference between these metrics and 12 hour in A&E measured from the time of a decision to admit is made is time IN ADDITION to that spent from time of arrival up to that decision.
From a quick read of the Age UK report, it’s not always clear which metric is being used: given that much of the report’s focus is on ‘corridor care’, it may be the ‘time from decision to admit’ metric. If so, the contrast between NHS England and NHS Scotland may be even more stark, in the latter’s favour.
NHS Scotland performance likely to be even further ahead as five examples of cover-up and distortion by NHS England managers is revealed
We already know that, based on trusting the current published NHS England data, NHS Scotland’s A&E service is around 3 times better on the crucial 12 hour waits1 and twice as effective on cancer treatment waits.2
However, after decades of rampant managerialism, there have been a number of scandals where these managers, more concerned with image than truth, have introduced procedures to hide the facts.
First, back in 2018, it became apparent that NHS England had the dubious practice of restarting the clock after A&E patients are admitted whereas in Scotland counting continues from first arrival.3 See this:
Second and similarly, by stewartb, in April 2023:
After a long-running campaign by the Royal College of Emergency Medicine (RCEM), NHS England has altered the way it reports monthly performance data on long waits by patients attending its major (Type 1) A&E departments.
In evidence to a House of Lords committee (on 19 January 2023), the prevailing practice of measuring 12-hour waits from the time of a ‘decision to admit’ (DTA) rather than from ‘time of arrival’ (TOA – as in Scotland) was described by Dr Adrian Boyle, President of the RCEM as “a fundamentally dishonest way of reporting data. It is hiding and doing our patients a disservice by minimising a very serious problem”.
NHS England has relented and published the first set of monthly data (for February 2023) on 12 hour waits measured from time of arrival at A&E to admission, transfer or discharge. This addresses an anomaly consistently highlighted here on TuS and just as consistently ignored by the corporate media and the BBC when reporting negatively on NHS Scotland.4
Third, on 10 October 2024, thanks to AR for alerting me:
This morning NHS England corrected a press release, a statistical notice and a dataset after Full Fact spotted an error in its waiting list data.
All of these originally said that the estimated number of patients waiting for non-emergency care in its referral to treatment (RTT) data fell by about 57,000 in August 2024, to 6.33 million.
In fact, this number rose by about 31,000 to 6.42 million.5
Fourth, 11 October 2024, thanks again to AR for alerting me:
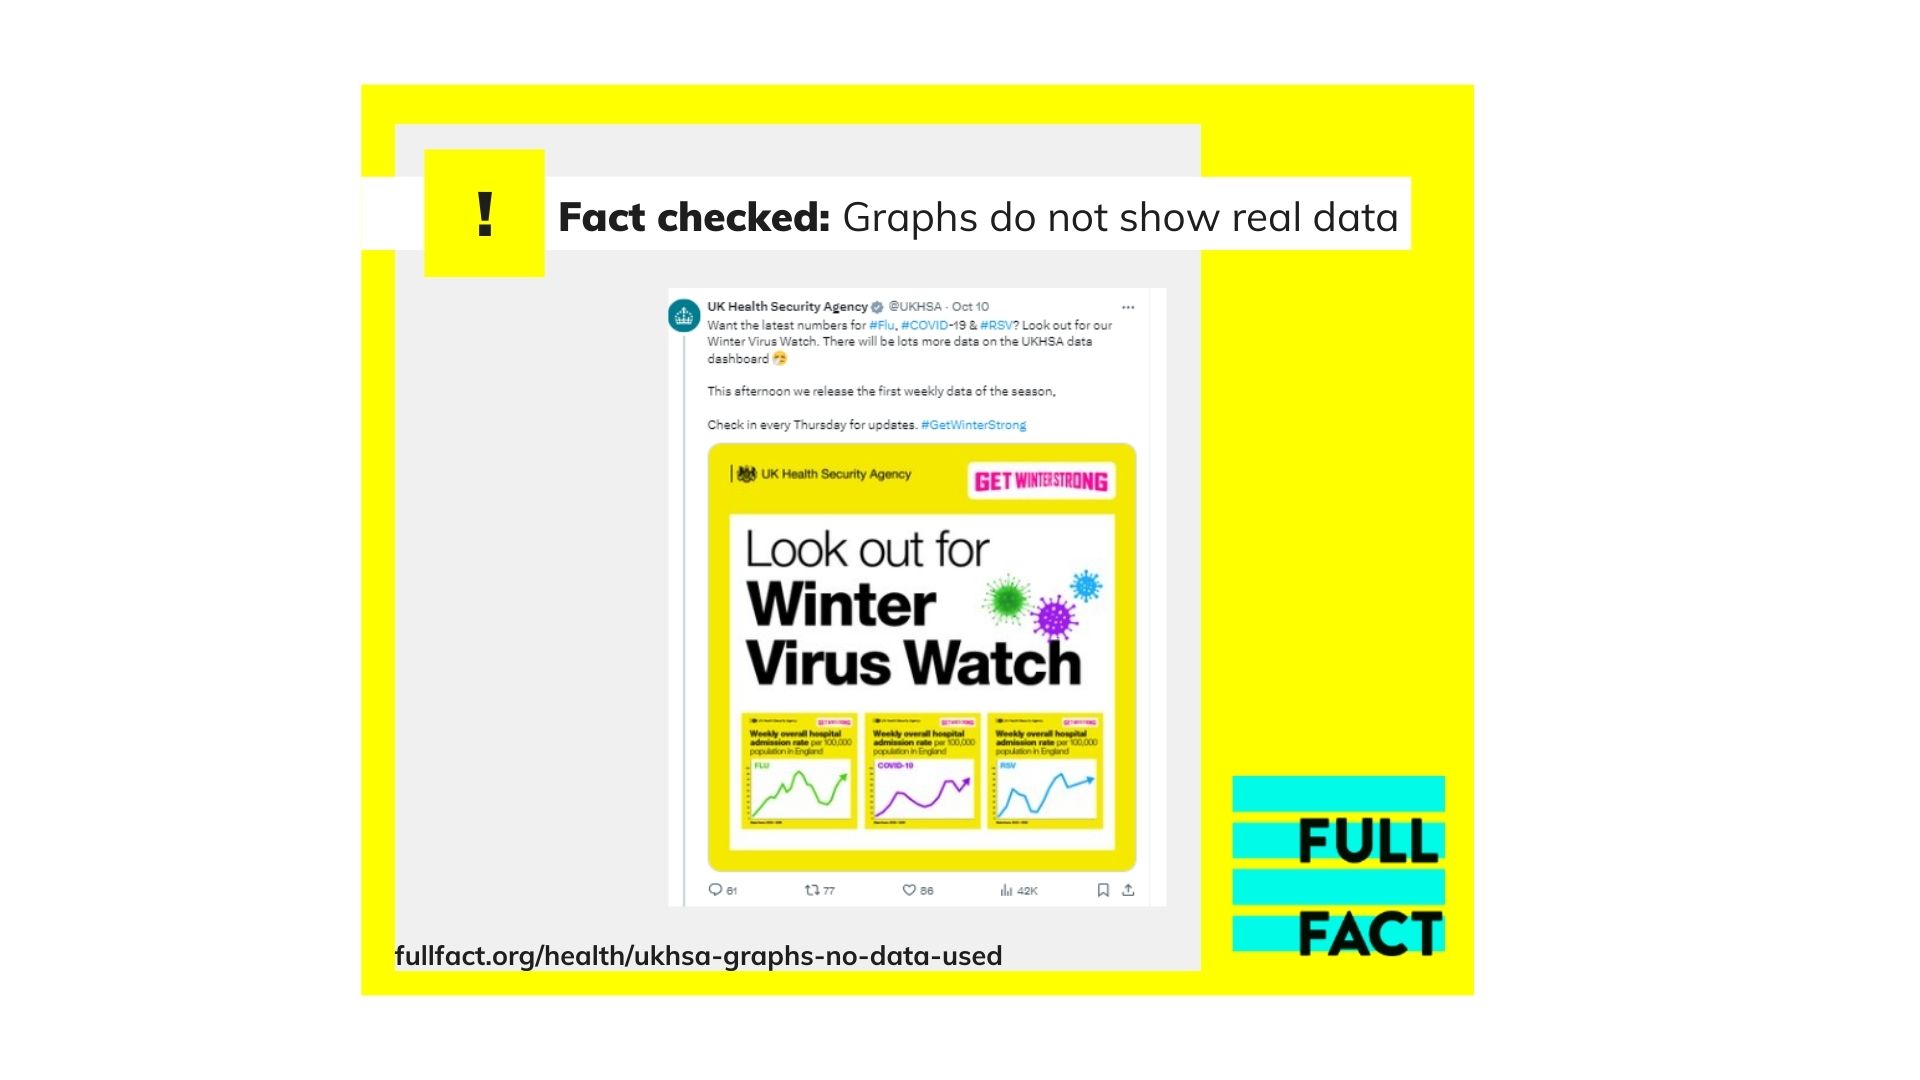
The UK Health Security Agency (UKHSA) has included several graphs depicting hospital admission rates for Covid-19, flu and respiratory syncytial virus (RSV) in a now deleted post on X (formerly Twitter). But the problem is that these aren’t actually based on any real data.
The graphs were contained within a graphic posted on 10 October promoting their “Winter Virus Watch” and the release of more data on the UKHSA data dashboard that afternoon.6
Finally and perhaps most serious, so serious that even the BBC reported it, in February this year:
Patients are facing delays stuck on hidden waiting lists that do not show up in the official figures in England, a BBC News investigation reveals.
The published waiting list stands at 7.6 million – but the true scale of the backlog is thought to be much higher.
This is because patients needing ongoing care are not automatically included in those figures – even if they face major delays.7
There have been no reports of such practice in NHS Scotland. Do you think Lisa Summers would not tell us if there were?
I suspect these are not the only abuses by NHS England but are sufficient to reinforce the view that NHS England data often cannot be trusted, have been manipulated to reduce the shock and suggest strongly that NHS Scotland’s superior performance may be even more so, were the facts known.
Sources:
- https://www.publichealthscotland.scot/our-areas-of-work/acute-and-emergency-services/urgent-and-unscheduled-care/accident-and-emergency/interactive-charts/how-long-people-spend-in-ae/
- https://www.ons.gov.uk/peoplepopulationandcommunity/healthandsocialcare/healthcaresystem/articles/waitingtimesforcancertreatmentacrosstheuk/2024-08-23
- https://gss.civilservice.gov.uk/wp-content/uploads/2018/05/UK-Comparative-Waiting-Times-AE-final.xlsx
- https://www.england.nhs.uk/statistics/statistical-work-areas/ae-waiting-times-and-activity/ae-attendances-and-emergency-admissions-2022-23/
- https://fullfact.org/health/nhs-england-rtt-waiting-list-error/?utm_source=Full+Fact+Newsletter&utm_campaign=3accc365a0-October&utm_medium=email&utm_term=0_-3accc365a0-%5BLIST_EMAIL_ID%5D
- https://fullfact.org/health/ukhsa-graphs-no-data-used/?utm_source=Full+Fact+Newsletter&utm_campaign=3accc365a0-October&utm_medium=email&utm_term=0_-3accc365a0-%5BLIST_EMAIL_ID%5D
Discover more from Talking-up Scotland
Subscribe to get the latest posts sent to your email.

Given that these are Trusts operating like companies, with funding dependant on results, of course they will ‘manage’ the figures – Then you have the political filtering where the information is collated, where there will be further pressure to further ‘manage’ the figures….
LikeLiked by 2 people